How closely does the band's footpod track the treadmill?
barban · 18 August 2026
Follow-up to Reverse-engineering the Mi Band footpod protocol. There I promised numbers; here they are.
A footpod is only as good as its speed. So the obvious question, once OmniBandBridge (OBB) could read the band’s footpod stream: how closely does that speed actually match the treadmill belt? And does a cheap band hold up against a “real” footpod?
I have both a Xiaomi Mi Band 10 (footpod mode) and an Under Armour HOVR (Atlas) in-sole pod, so I ran the same treadmill, recorded each with OBB, and compared the footpod speed to the belt’s own FTMS speed — the calibration factor = footpod speed ÷ treadmill speed. A factor of 1.00 means perfect agreement.
How the factor was measured
Section titled “How the factor was measured”Both runs were walk/run interval sessions. For each I pulled the per-second samples from OBB (more on how below), split the workout into segments of constant treadmill speed, dropped anything shorter than 30 s (the ramps between speeds) and the first 5 s of each segment (the footpod lags a speed change), and computed, per segment, the mean footpod speed ÷ mean belt speed. The belt was set in mph, so the speeds land on values like 4.02 (2.5 mph) and 8.05 km/h (5.0 mph).
The result in one picture
Section titled “The result in one picture”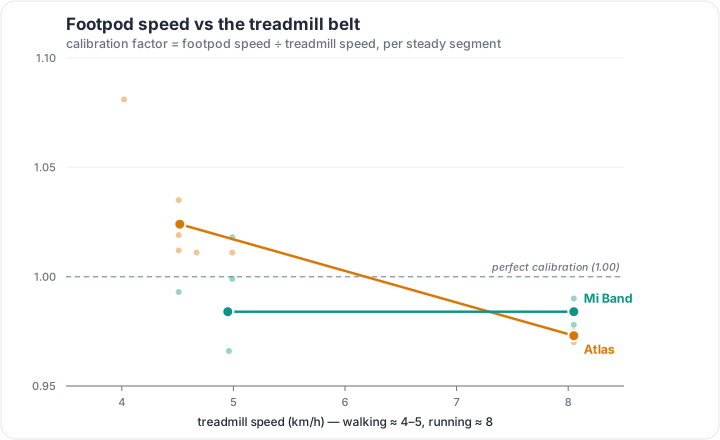
Each faint dot is one steady segment; the bold line joins each footpod’s walking and running averages. Two clearly different characters jump out:
- The Mi Band 10 (teal) is almost perfectly flat: it reads a consistent ~1.6 % low whether you walk or run.
- The UA HOVR Atlas (orange) drifts with pace: it reads high at a slow walk and low at a run, sloping right through 1.00 somewhere around 7 km/h.
The numbers
Section titled “The numbers”Mi Band 10 — 25 Jul, treadmill, footpod (pebble) mode:
| phase | treadmill km/h | mph | footpod km/h | factor | cadence | duration |
|---|---|---|---|---|---|---|
| walk | 4.51 | 2.8 | 4.48 | 0.993 | 101 | 59 s |
| run | 8.05 | 5.0 | 7.93 | 0.985 | 145 | 122 s |
| walk | 4.99 | 3.1 | 5.08 | 1.018 | 114 | 161 s |
| run | 8.05 | 5.0 | 7.97 | 0.990 | 146 | 119 s |
| walk | 4.99 | 3.1 | 4.99 | 0.999 | 112 | 259 s |
| run | 8.05 | 5.0 | 7.87 | 0.978 | 145 | 124 s |
| walk | 4.96 | 3.1 | 4.79 | 0.966 | 107 | 574 s |
UA HOVR (Atlas) — 31 Jul, same treadmill:
| phase | treadmill km/h | mph | footpod km/h | factor | cadence | duration |
|---|---|---|---|---|---|---|
| walk | 4.02 | 2.5 | 4.35 | 1.081 | 98 | 134 s |
| walk | 4.51 | 2.8 | 4.67 | 1.035 | 102 | 130 s |
| run | 8.05 | 5.0 | 7.85 | 0.975 | 150 | 58 s |
| walk | 4.99 | 3.1 | 5.05 | 1.011 | 106 | 79 s |
| walk | 4.67 | 2.9 | 4.72 | 1.011 | 102 | 228 s |
| run | 8.05 | 5.0 | 7.81 | 0.970 | 149 | 59 s |
| walk | 4.51 | 2.8 | 4.59 | 1.019 | 100 | 321 s |
| run | 8.05 | 5.0 | 7.84 | 0.974 | 149 | 59 s |
| walk | 4.51 | 2.8 | 4.56 | 1.012 | 100 | 313 s |
Duration-weighted summary:
| Footpod | Walk | Run | Overall | Character |
|---|---|---|---|---|
| Mi Band 10 | 0.984 | 0.984 | 0.984 | flat, ~1.6 % low, pace-independent |
| UA HOVR (Atlas) | 1.024 | 0.973 | 1.017 | drifts: +8 % at 2.5 mph → −3 % at 5 mph |
What it means
Section titled “What it means”Both footpods land within a few percent of the belt — close enough that the raw speed is perfectly usable for a Zwift session or a treadmill run without any correction. But the shape of the small error differs, and that’s the interesting part:
- The Mi Band behaves like a tape measure that’s uniformly a hair short. One constant (≈ ×1.016) would correct it across the whole pace range.
- The Atlas is accurate in the mid-range but its error tilts with pace — a single constant can’t fix that; you’d need a small pace-dependent curve.
Neither is “wrong”; they just carry different systematic biases. And you only ever see that bias when you can line up footpod speed and belt speed sample-by-sample — which is exactly what OBB records.
Reproduce it on your own runs — with OBB’s AI journal
Section titled “Reproduce it on your own runs — with OBB’s AI journal”Here’s the part I want to highlight, because it’s the whole point. I didn’t write a bespoke analysis script and wrangle CSVs by hand. OBB ships an on-device AI journal: a small local HTTP API, on your own WiFi, that exposes your workouts and their per-second samples to an AI model you choose (BYOM) — nothing leaves your phone. I pointed a model at it and asked.
If you run OBB with a treadmill that broadcasts FTMS speed, you can reproduce this whole study on your own data with a prompt like:
Using my OmniBandBridge AI journal, take my most recent treadmill workout that has bothfootpod speed and treadmill (FTMS) speed.
Split it into segments of constant treadmill speed. Discard segments shorter than 30 s andthe first 5 s of every segment (the footpod lags a speed change).
For each remaining segment, report: treadmill speed (km/h and mph), mean footpod speed, thecalibration factor (footpod ÷ treadmill), cadence, and whether it's walking or running.
Then give me the duration-weighted factor for walking, for running, and overall — and tell mewhether my footpod reads consistently or drifts with pace.
The model reads the samples over the LAN, does the segmentation and the arithmetic, and hands back a table like the ones above — for your shoe, your treadmill, your stride. That’s the difference between “the app shows you charts” and “you can ask your data a question.”
Want to try it? OmniBandBridge is a free Android app — footpod mode, live RSC/FTMS/HR re-broadcast to Zwift and treadmills, personalized metabolic power, full workout export, and the local AI journal. See Getting started.